Dashboard
Overview
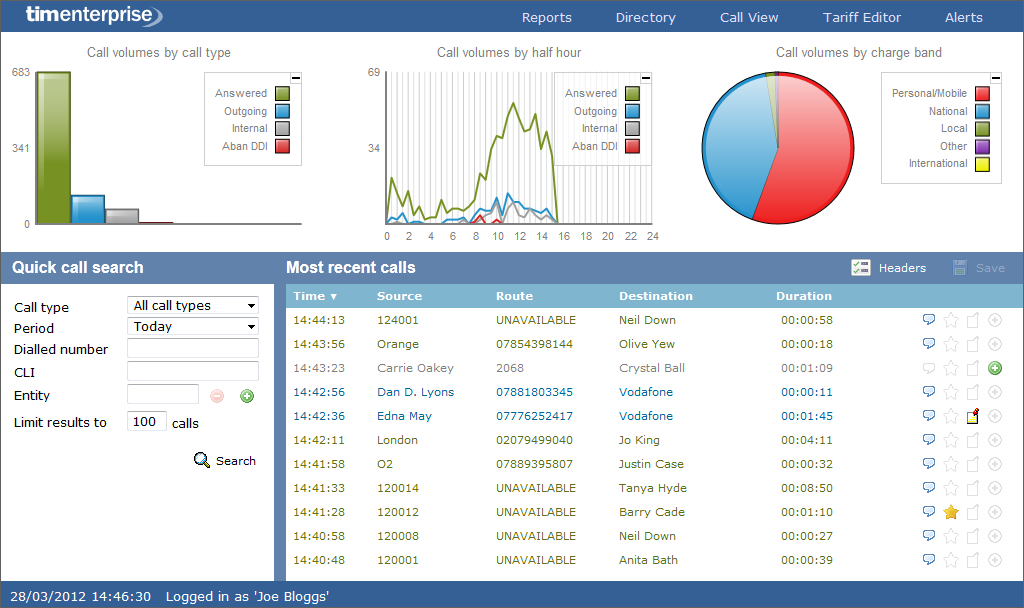
When logging in to TIM Enterprise, the following dashboard screen is displayed:
The information you see on this screen is relevant only to the area which you've been granted access to. For example:
- If you are a site administrator, the graphs, live call view and any other call-related information will be derived from calls that happened only on your own site and not those from any other sites within the system.
- If your login account is restricted to a specific user group (department), the statistics will relate only to the call information for users within that particular group.
Layout
Toolbar
The dashboard screen consists of a toolbar along the top of the page and three main panels.
The toolbar is the main menu that you use to navigate the major features of TIM Enterprise. The tabs that make up the toolbar differ according to the type of account you use to log in with. The screenshot above displays an example dashboard screen for a user account that has administrative privileges whereby all of the tabs are present; however, for a restricted web user account, some of the tabs might not be visible.
Panels
The three panels that make up the dashboard screen are as follows:
- Summary graphs
- Quick call search
- Most recent calls
Summary graphs
note
The information you see in each graph pertains only to the area which the logged-in user has been granted access to.
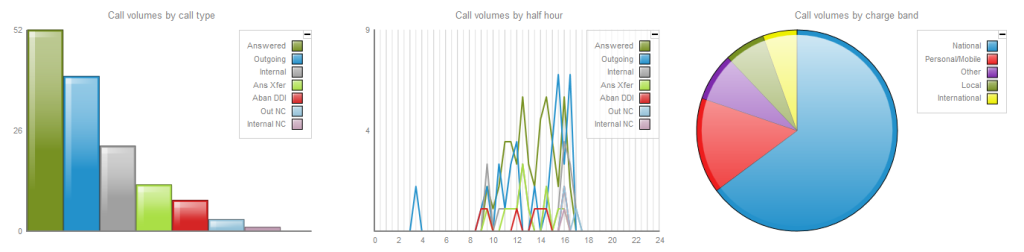
The summary graphs panel consists of three separate graphs, each organising their information using different criteria, as described below:
Call volumes by call type
This first graph shows a snapshot of calls for the current day, based on the type of call, e.g. inbound, outbound, missed.
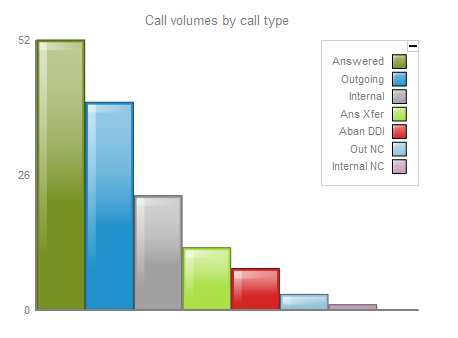
Each call type in the graph is colour-coded as follows:
| Colour | Call type |
|---|---|
| Green | Incoming calls |
| Light green | Answered transferred calls |
| Blue | Outgoing calls |
| Light blue | Outgoing non-connected calls |
| Grey | Internal calls |
| Mauve | Internal non-connected calls |
| Red | Abandoned DDI (Direct Dialled In) calls |
| Pink | Tandem calls |
Call volumes by half hour
This graph shows a snapshot of calls for the current day, broken down by half-hour, allowing you to quickly identify peaks and troughs in call volumes to identify busy periods.
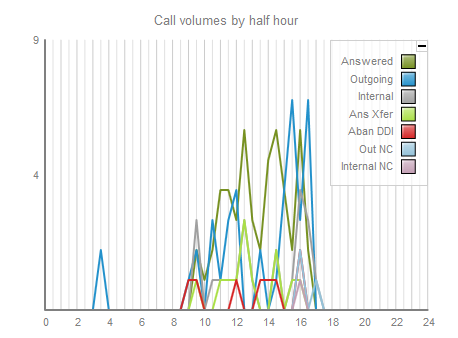
Each call type in the graph is colour-coded as follows:
| Colour | Call type |
|---|---|
| Green | Incoming calls |
| Light green | Answered transferred calls |
| Blue | Outgoing calls |
| Light blue | Outgoing non-connected calls |
| Grey | Internal calls |
| Mauve | Internal non-connected calls |
| Red | Abandoned DDI (Direct Dialled In) calls |
| Pink | Tandem calls |
Call volumes by charge band
This graph shows a snapshot of calls for the current day, based on their destination, allowing you to identify where you call most often. Calls are grouped into geographical locations such as Mobile, National, Local, International etc.
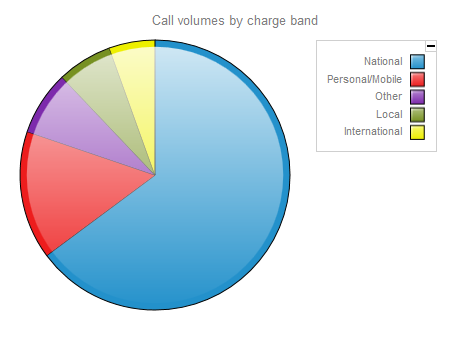
By default, the following colour scheme is used to identify calls to each geographical group:
| Colour | Call type |
|---|---|
| Red | Personal/Mobile calls |
| Green | Local calls |
| Blue | National calls |
| Yellow | International calls |
| Purple | Other calls |
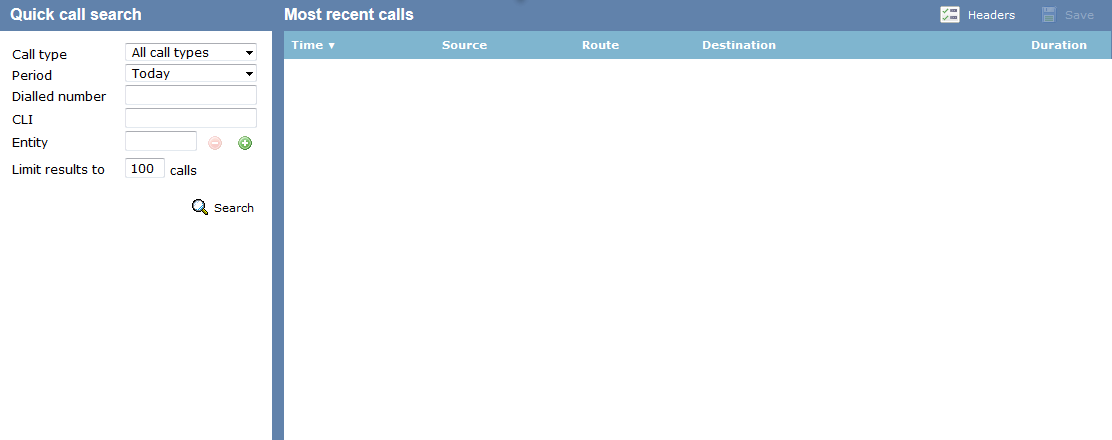
Quick call search
The Quick call search panel offers a rapid way to locate specific calls in the central database, as an alternative to running a full call report. You can refine your search results by using the filters described below:
Call type
This filter allows you to define the type of call you want your search results to cover, e.g. incoming, outgoing, internal etc. To include all types of call, set this to All call types.

Period
The Period search field defines the time period the results should cover. To choose a period, select it from the drop-down list.

There are several preset reporting periods available for selection, based on the standard Gregorian calendar. The following table describes how the start and end times are defined for each preset period:
| Field | Description |
|---|---|
| Today | The start and end dates are set to the current date. The start time is set to 00:00:00 and the end time to 23:59:59. |
| Yesterday | The start and end dates are set to the current date minus one day. The start time is set to 00:00:00 and the end time to 23:59:59. |
| This week | The start date is set to the first day (normally Monday) of the current week. The end date is set to the current day. The start time is set to 00:00:00 and the end time to the current time. |
| Last week | The start date is set to the date of the last Monday, and the end date is set to the start date plus seven days. The start time is set to 00:00:00 and the end time to 23:59:59. |
| This month | The start date is set to the first day of the current month. The end date is set to the current day. The start time is set to 00:00:00 and the end time to the current time. |
| Last month | The start date for this period is set in three stages: The day is set to the first day of the month. The month is set to the previous month. The year is set to the current year, unless it is currently January, in which case, the previous year is used. The start and end times are set to 00:00:00 and 23:59:59 respectively. |
| This year | The start date is set to the first day of the first month of the current year, whilst the end date is set to today's date. The start and end times are set to 00:00:00 and 23:59:59 respectively. |
| All calls | The start and end dates and times are set to the dates and times of the first and last call in the entire call database, respectively. |
| Custom | Enter the start and end dates and times into the boxes provided. The start and end times are linked to their respective dates. |
Dialled number
The Dialled number field allows you to filter your results by the number that was dialled. You can also specify a partial number to match all calls beginning with that number, e.g. to show all calls to London, enter 0207.
![]()
CLI
Calling Line Identification (CLI) is the telephone number of the remote caller in an incoming call scenario.
You can filter your results to show only calls that originate from a specific CLI or those whose CLI matches a particular pattern of digits. For example, to report on all incoming calls from London, you could enter 0207.
![]()
Entity
If you want to limit the search results to a particular site, group or user, click on the ![]() button, as shown below:
button, as shown below:
![]()
A new window will open, allowing you to navigate through the Directory in order to locate the entity whose calls the search results should include. To select an entity, click on the ![]() icon alongside it.
icon alongside it.
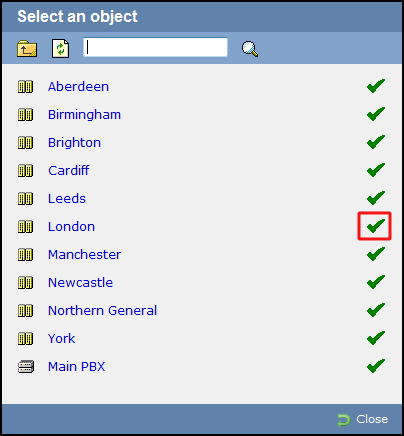
If you want to search for a specific entity, you can enter its name in the search bar at the top of the window and click on the ![]() icon.
icon.
Limit results to
This feature enables you to specify the maximum number of search results you want to retrieve. Set the limit by entering a value in the field provided, e.g. entering 50 in the Limit results to field, will return a maximum of 50 results.
![]()
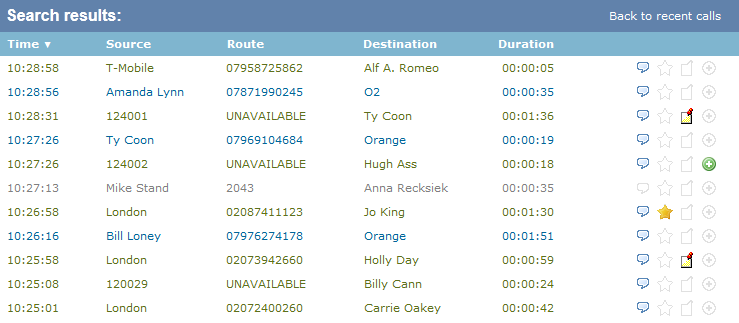
The search results will show in a new panel entitled Search results, as shown below:

To close the search results and return to the Most recent calls panel, click on the Back to recent calls link, at the top-right corner of the panel.
Most recent calls
By default, the Most recent calls panel displays the latest calls to have been processed by TIM Enterprise, with the most recent towards the top of the list. To sort the results by a different column, click on the relevant column header.
Each call type is colour-coded using a system-wide colour scheme, as follows:
| Colour | Call type |
|---|---|
| Green | Incoming calls |
| Light green | Answered transferred calls |
| Blue | Outgoing calls |
| Light blue | Outgoing non-connected calls |
| Grey | Internal calls |
| Mauve | Internal non-connected calls |
| Red | Abandoned DDI (Direct Dialled In) calls |
| Pink | Tandem calls |
info
The calls you see in the Most recent calls panel pertain only to the area to which the logged-in user has been granted access; administrators see calls from all sites.
Column headers
The column headers shown in the most recent calls list are specific to each web user and can be customised by clicking on the Headers button, which will display the following selection panel:
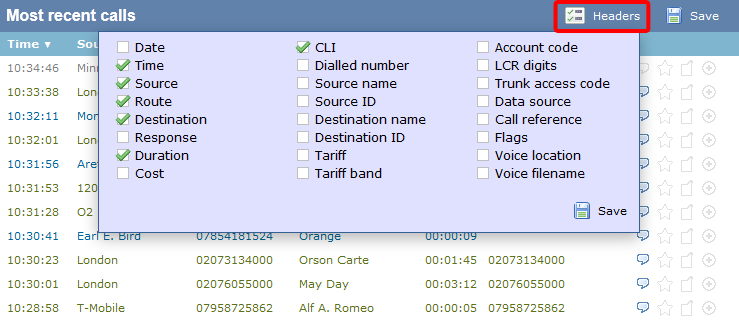
Include a column header in the list by ticking the box alongside each one. Click on the Save button to apply any changes.
Each column header is described below:
Date
The date the call started
Time
The time the call started
Source
The place from where the call originated
Route
The information displayed in this field is determined by the type of call:
- for incoming calls, this shows the CLI of the caller
- for incoming internal calls, this shows either the caller's username or extension number
- for outgoing calls, this shows the dialled number |
Destination
The information displayed in this field is determined by the type of call:
- for incoming calls, this shows the name of the user whose extension answered the call, or the extension number if not available
- for outgoing calls, this shows the geographical location that was dialled, or an alias if defined in your contacts list
- for internal calls, this shows the extension that was dialled, enclosed in square brackets [ ]
Response
The time it took for the call to be answered (in seconds)
Duration
The duration of the call (in hours, minutes and seconds)
Cost
The cost of the call
CLI
The telephone number of the remote caller for inbound calls
Dialled number
The number that was dialled in order to reach a particular destination
Source name
The name of the person who made the call
Source ID
The ID of the person who made the call
Destination name
The name of the destination called, e.g. Manchester, Tri-Line, London
Destination ID
The ID of the destination called
Tariff
The name of the tariff table that was used to cost the call, e.g. BT
Tariff band
The specific tariff band that was used to cost the call, e.g. International, National, Mobile etc.
Account code
The account code associated with the call
LCR Digits
The Least Cost Routing (LCR) digits used to route the call
Trunk access code
The trunk access code used to access a group of channels
Data source
The location where the call originated
Call reference
Any call reference number associated with the call
Flags
Any flags associated with a call, as described below:
- The call has no associated voice recording
- The call has an associated voice recording; click on the icon to listen to the call
- The call has not been scored; click on the icon to score the call
- The call has been scored; click on the icon to review scoring information for the call
- The call has not been annotated; click on the icon to add a note to the call
- The call has one or more associated notes; click on the icon to review the note(s)
- The call has no related transfer legs
- The call has related transfer legs; click on the icon to view all transfers associated with the call
Voice location
The unique ID of the call recording device that captured audio for the call
Voice filename
The unique call reference identifying any voice recording associated with the call
Reordering column headers
Each column header can be reordered by clicking and dragging it to the new location, as shown below:
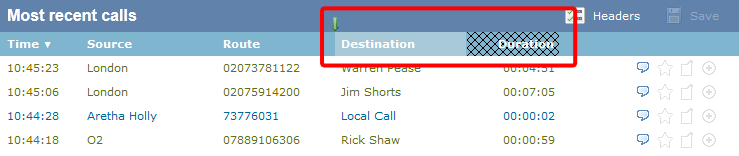
Columns can be sorted by clicking the relevant column header, with each click toggling between ascending and descending order.
tip
Any layout changes you make to the Most recent calls panel are saved only for the current web user and do not affect other web users.